Hunting Memory Leaks in bsnmpd with DTrace

One of my FreeBSD boxes runs bsnmpd, the base system SNMP daemon.
The machine is on 15.0-p2, and the daemon kept growing until the kernel ran out of patience and OOM-killed it.
That is not a good feature for a daemon.
I could have just added a cron job to restart it and called it a day. But a leak that kills a long-running daemon is exactly the kind of thing I like to chase, and I already had a tool for it.
A small tool for a large problem
Some time ago I started working on a small tool called dtrace-memanalyzer. It seemed like a good fit for this problem. It has two parts. A DTrace script that records every allocation. And a bit of Python that helps to find the problems and visualize them.
The DTrace side is built into the tool, so you can easily use it with the dtrace command:
dtrace -n "$(dtrace-memanalyzer probe)" -p "$(pgrep bsnmpd)" > mem_dtrace
Under the hood the probe hooks malloc, calloc, realloc and free.
On every allocation it prints the returned pointer, the size, a timestamp and the full user stack:
pid$target::malloc:return /self->trace == 1/ {
        printf("Ptr=0x%p Size=%d Time=%d", arg1, self->size, timestamp);
        ustack();
        self->trace = 0;
        self->size = 0;
}
This is the entire idea behind this tool: pair every malloc with its matching free by pointer.
Whatever is left without a free is a candidate leak, with a stack attached that tells you where it happened.
Two terminals
My setup for this was very simple. In one terminal I watched the process grow, once a minute:
while true; do
    ps auxw | grep '[b]snmpd'
    sleep 60
done
In the other terminal I ran the DTrace capture above and let it collect for a while.
The ps loop tells you that you are leaking.
DTrace tells you where.
A quick word of warning: tracing every allocation in a busy process is not free. The capture file grew to over half a gigabyte, and the daemon was probably slower. This is a debugging session, not something you leave running in production.
Looking at the shape of the leak
Before reading any stacks, it helps to see the shape of the problem. The tool can plot the live memory over time, either as a static image or as an interactive page where hovering over a point shows you the allocation stack behind it:
# A static PNG.
dtrace-memanalyzer visualize --infile mem_dtrace \
    --format png --outfile snmpd_memgrowth.png

# An interactive HTML page with the stacks on hover.
dtrace-memanalyzer visualize --infile mem_dtrace \
    --format html --outfile snmpd_memgrowth.html
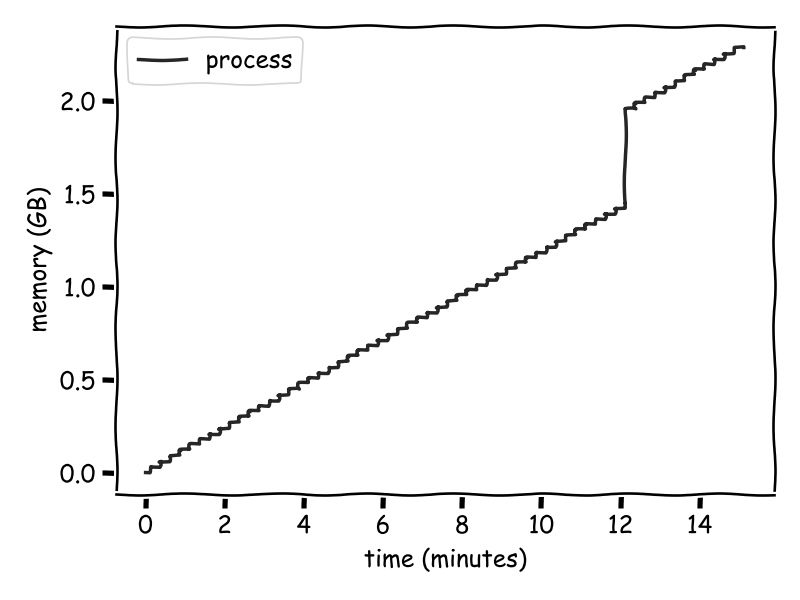
The line is a staircase that only goes up, from zero to roughly 2.3 GB, and never comes back down. A healthy daemon under steady load should allocate and deallocate some memory, which means that there should be some fluctuation in the memory usage. And here we are growing indefinitely.
First leak: the filesystem table
The leak command pairs allocations with frees and groups whatever is left by stack.
Each group comes with a count and the total bytes still outstanding:
dtrace-memanalyzer leak --infile mem_dtrace
One of the first entries that caught my eye was this:
=== Memory leak, data leaked = 1983, count = 1683
libc.so.7`malloc+0xa8
snmp_hostres.so.6`fs_tbl_process_statfs_entry+0x276
snmp_hostres.so.6`refresh_storage_tbl+0x502
snmp_hostres.so.6`op_hrStorageTable+0x1a
libbsnmp.so.7`snmp_getbulk+0x37f
bsnmpd`snmp_input_finish+0x213
...
A count of 1683 is the interesting part.
Each individual allocation is tiny, but the same call site keeps leaking a little, over and over, every time something walks hrStorageTable.
The stack points straight at fs_tbl_process_statfs_entry in the snmp_hostres module.
This is the function that turns a statfs(2) result into an entry in the host resources filesystem table.
Here is the part that matters, from usr.sbin/bsnmpd/modules/snmp_hostres/hostres_fs_tbl.c:
if ((entry = fs_find_by_name(fs_p->f_mntonname)) != NULL ||
    (entry = fs_entry_create(fs_p->f_mntonname)) != NULL) {
        entry->flags |= HR_FS_FOUND;

        if (!(fs_p->f_flags & MNT_LOCAL)) {
                /* this is a remote mount */
                entry->remoteMountPoint = strdup(fs_p->f_mntfromname);
                /* if strdup failed, let it be NULL */
        } else {
                entry->remoteMountPoint = strdup("");
                /* if strdup failed, let it be NULL */
        }
        ...
Look at this tricky if statement.
The entry is either found (fs_find_by_name), because it already exists, or freshly created (fs_entry_create).
In the found case the code does entry->remoteMountPoint = strdup(...) and overwrites the pointer from the previous refresh, without freeing the old string first.
So every walk of the storage table duplicates the mount point for every mounted filesystem and leaves the previous pointer hanging. On a host that gets polled regularly, with a handful of filesystems, those small strings add up.
The fix was to free the old value before replacing it, and also to make sure a new entry starts with a NULLed remoteMountPoint.
This works because free(NULL) is a no-op, so we no longer care if the entry was created or found - we can safely free the old memory in both cases.
I sent this as D57604, and it landed in main as 28ddd11d.
The big one: pf and the netlink arena
Another problem came from a completely different place:
=== Memory leak, data leaked = 503316544, count = 1
libc.so.7`calloc+0x16e
snmp_pf.so.6`pfctl_get_rule_h+0xe
snmp_pf.so.6`...
snmp_pf.so.6`pf_lbltable+0x36
libbsnmp.so.7`snmp_getbulk+0x37f
bsnmpd`snmp_input_finish+0x213
...
One allocation, 503316544 bytes - that is 480 MiB in a single calloc.
The stack runs through snmp_pf, the module that exposes pf state over SNMP, and lands in pfctl_get_rule_h from libpfctl.
That is the modern, netlink-based way to talk to pf.
Here is what is going on.
A pfctl_handle embeds an snl_state, and that state owns an arena that backs both the netlink requests and the parsing of the replies.
The arena only grows.
When it runs out of space, it doubles: one new calloc, twice the size.
That is why the count is 1 - my capture simply caught the latest doubling.
It is reset in exactly one place: snl_free(), called from pfctl_close().
For a normal program this is fine.
pfctl opens a handle, does its work, closes the handle, and the arena dies with the process.
But bsnmpd is not a normal program here.
The snmp_pf module opens one handle when it starts and keeps it open for the entire life of the daemon, polling pf on every relevant SNMP request.
The handle never closes, so the arena never resets, so it grows until the graph hits a cliff and the OOM killer steps in.
I traced it, understood it, and wrote a fix: reset the arena at the start of each netlink transaction instead of only at close. I even opened a review for it, D57737.
Read main before you write the patch
When kp@ looked at my review, he pointed out that the bug was already fixed in main, about two weeks earlier. He had fixed it himself, in two commits.
One of them, fcb31b57, does essentially what I was proposing: explicitly reset the snl_state when a transaction is done, instead of leaving it to grow until pfctl_close().
The commit message even calls out the same victim:
We still had a reference to the memory and would release it on
pfctl_close()(so valgrind did not detect it as a leak), but long-lived users (e.g.bsnmpd) would eventually run out of memory.
That is my exact bug, described better than I would have described it, and fixed before I started.
The other commit, 2a478dfc, is a related cleanup that looks up the pf family id once per handle instead of once per call.
The reason I missed all of this is very simple.
I was reading and patching the source on my box, which runs 15.0-p2.
The fix lived in main.
I had written a patch for a bug that no longer existed in the tree I should have been checking first.
So I abandoned my review, cherry-picked kp@'s two commits onto my branch, and rebuilt.
Not every malloc is a leak
While reading the output I also hit this one:
=== Memory leak, data leaked = 25833824, count = 1
libc.so.7`malloc+0xc1
libmemstat.so.3`memstat_sysctl_all+0x11
snmp_hostres.so.6`refresh_storage_tbl+0x62b
snmp_hostres.so.6`op_hrStorageTable+0x1a
...
About 25 MB sitting there unfreed. But look at the count: it is just 1 allocation.
This is the difference between a leak and a buffer that is still in use when you stopped tracing.
memstat_sysctl_all allocates a big chunk to read the kernel's memory statistics, and snmp_hostres keeps that list around and reuses it across refreshes.
It is a one-time allocation, not something that grows on every poll.
The tool flags everything that was not freed during the trace, which is exactly what you want, but it cannot know the intent. A real leak shows up as a high count, or as a single allocation that keeps getting bigger every run.
Three findings, three lessons
The filesystem table leak was a real bug that I managed to fix.
The pf leak taught me to check main before doing the heavy lifting.
The memstat buffer was not a leak at all, and the lesson was to read the count before stepping in.
My small tool did its job.